


Car Accident Severity
1. Introduction/Business Problem
1.1 Report
Road traffic crashes result in the deaths of approximately 1.35 million people around the world each year and leave between 20 and 50 million people with non-fatal injuries. More than half of all road traffic deaths and injuries involve vulnerable road users, such as pedestrians, cyclists and motorcyclists and their passengers (1).
A number of factors contribute to the risk of collisions, including vehicle design, speed of operation, road design, road environment, driving skills, impairment due to alcohol or drugs, and behavior, notably distracted driving, speeding and street racing (2).
A number of physical injuries can commonly result from the blunt force trauma caused by a collision, ranging from bruising and contusions to catastrophic physical injury (e.g., paralysis) or death (2).
Human factors in vehicle collisions include anything related to drivers and other road users that may contribute to a collision. Examples include driver behavior, visual and auditory acuity, decision-making ability, and reaction speed (2).
1.2 Target
This project looks into using various Python-based machine learning and data science libraries in an attempt to build a machine learning model capable of predicting Car Accident Severity.
2. Data
2.1 Data Source
The Original Data Came from:
3. Feature
Create Data Dictionary
LOCATION : Description of the general location of the collision
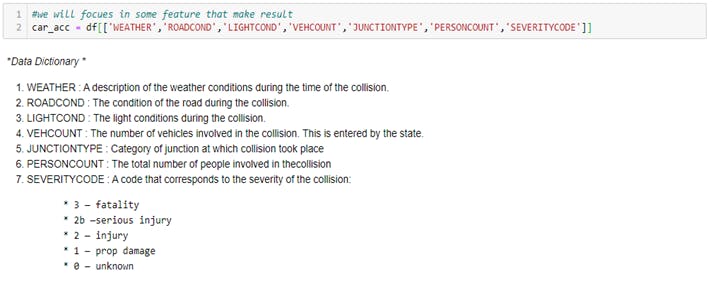
SEVERITYCODE : A code that corresponds to the severity of the collision:
   * 3 — fatality
   * 2b —serious injury
   * 2 — injury
   * 1 — prop damage
   * 0 — unknown
SEVERITYDESC : A detailed description of the severity of the collision
COLLISIONTYPE : Collision type
- PERSONCOUNT : The total number of people involved in the collision
- PEDCOUNT : The number of pedestrians involved in the collision. This is entered by the state.
- PEDCYLCOUNT : The number of bicycles involved in the collision. This is entered by the state.
- VEHCOUNT : The number of vehicles involved in the collision. This is entered by the state.
- INJURIES : The number of total injuries in the collision. This is entered by the state.
- SERIOUSINJURIES : The number of serious injuries in the collision. This is entered by the state.
- FATALITIES : The number of fatalities in the collision. This is entered by the state.
- INCDATE : The date of the incident.
- INCDTTM : The date and time of the incident.
- JUNCTIONTYPE : Category of junction at which collision took place
- SDOT_COLCODE : A code given to the collision by SDOT.
- SDOT_COLDESC : A description of the collision corresponding to the collision code.
- INATTENTIONIND : Whether or not collision was due to inattention. (Y/N)
- UNDERINFL : Whether or not a driver involved was under the influence of drugs or alcohol.
- WEATHER : A description of the weather conditions during the time of the collision.
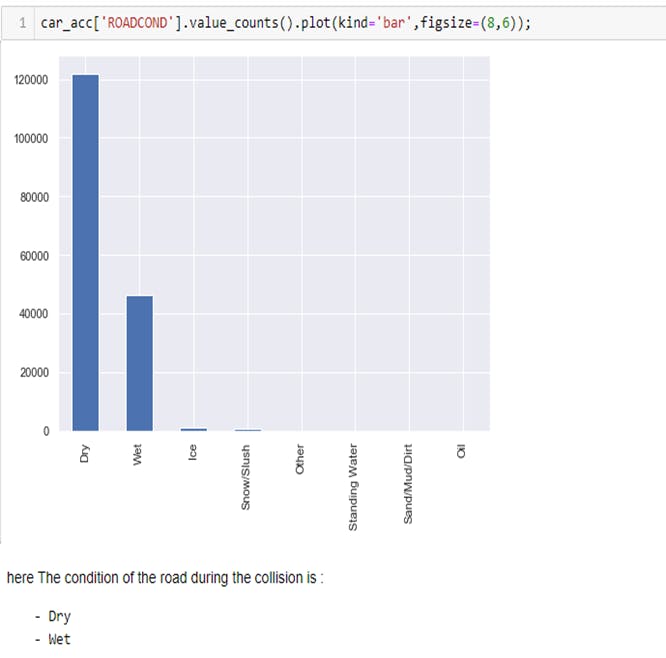
- ROADCOND : The condition of the road during the collision.
- LIGHTCOND : The light conditions during the collision.
- PEDROWNOTGRNT : Whether or not the pedestrian right of way was not granted. (Y/N)
- SDOTCOLNUM : A number given to the collision by SDOT.
- SPEEDING : Whether or not speeding was a factor in the collision. (Y/N)
- ST_COLCODE : A code provided by the state that describes the collision.
- ST_COLDESC : A description that corresponds to the state’s coding designation.
- SEGLANEKEY : A key for the lane segment in which the collision occurred.
- CROSSWALKKEY : A key for the crosswalk at which the collision occurred.
- HITPARKEDCAR : Whether or not the collision involved hitting a parked car. (Y/N)
4. Methodology
4.1 Data Exploration
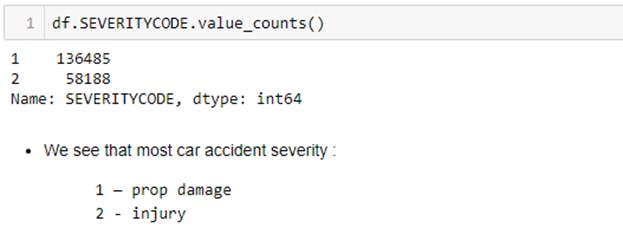
We look now for the target values ( SEVERITYCODE ) and do some analysis
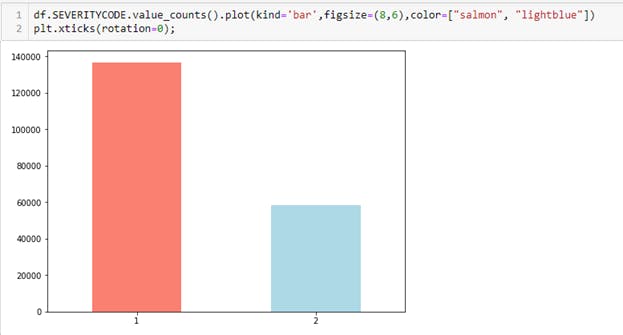
- Make some visualization
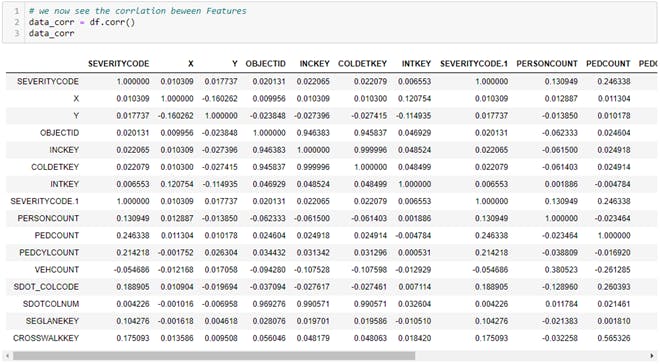
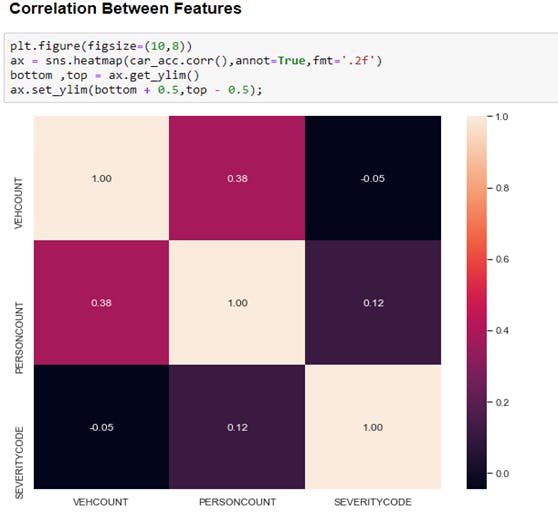
- Here we look at the correlation between Feature
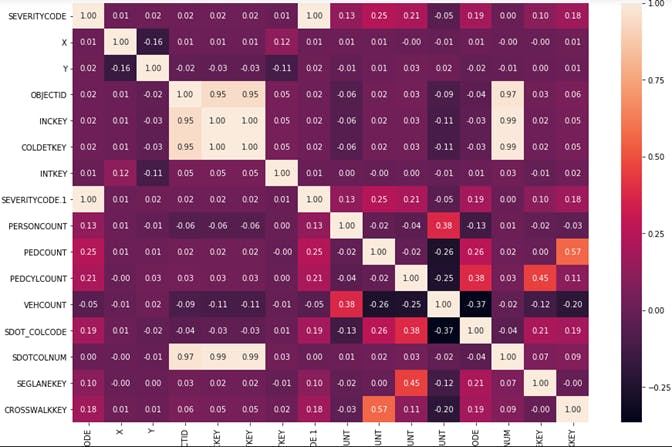
- Make Correlation more beautiful
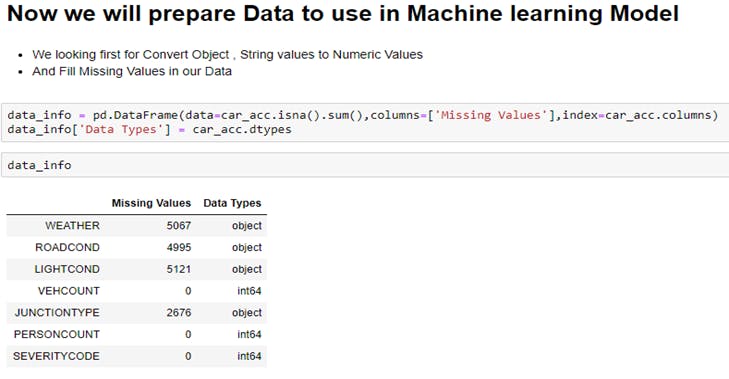
- We now will select feature that will help us in Machine learning Model
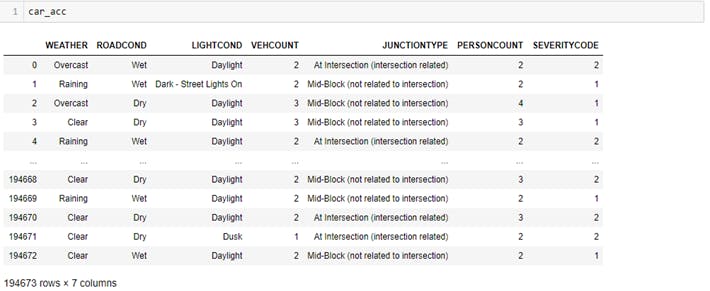
- This’s our data now
- Make Soma Analysis to our data :
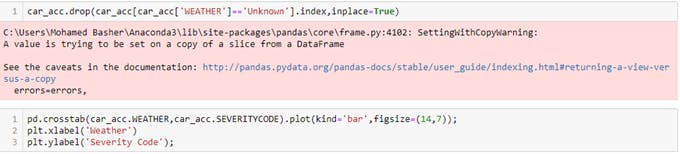
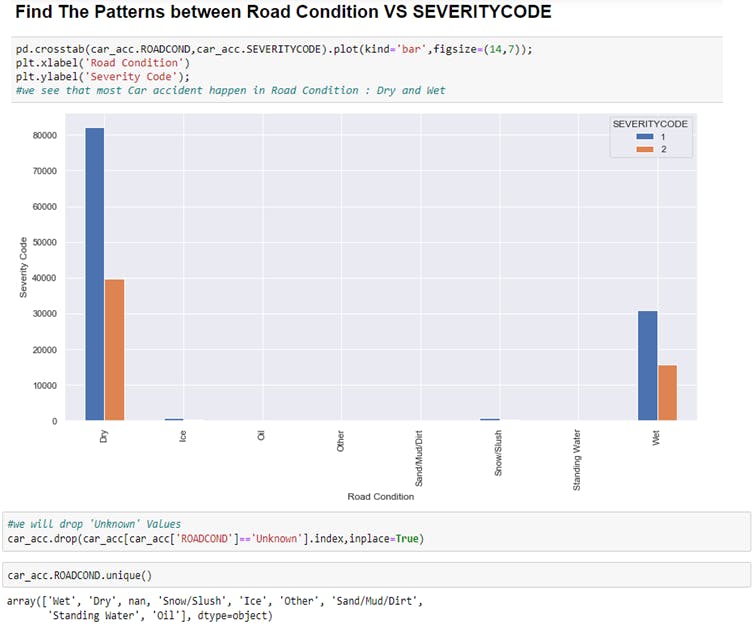
- Remove Outlier like “Unknown”
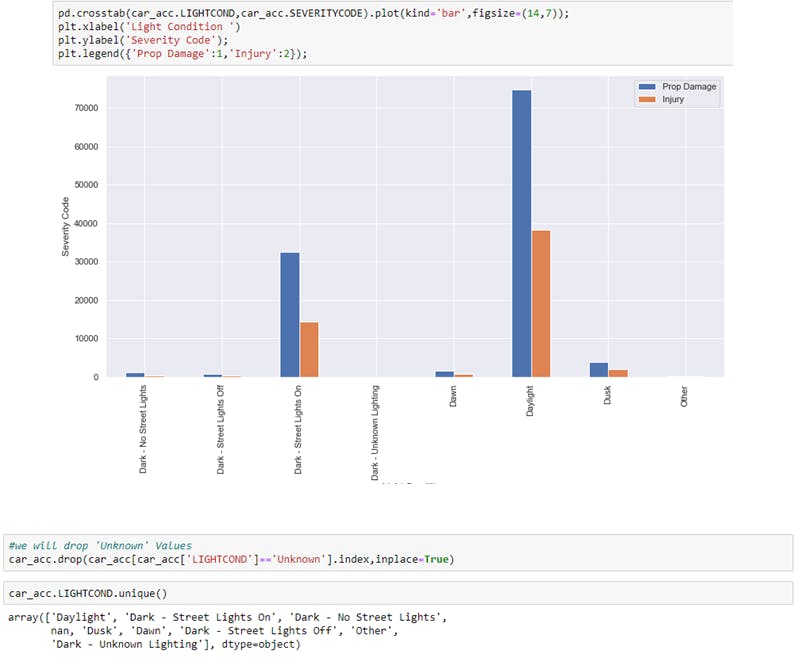
- Find Patterns between Light Condition VS SEVERITYCODE
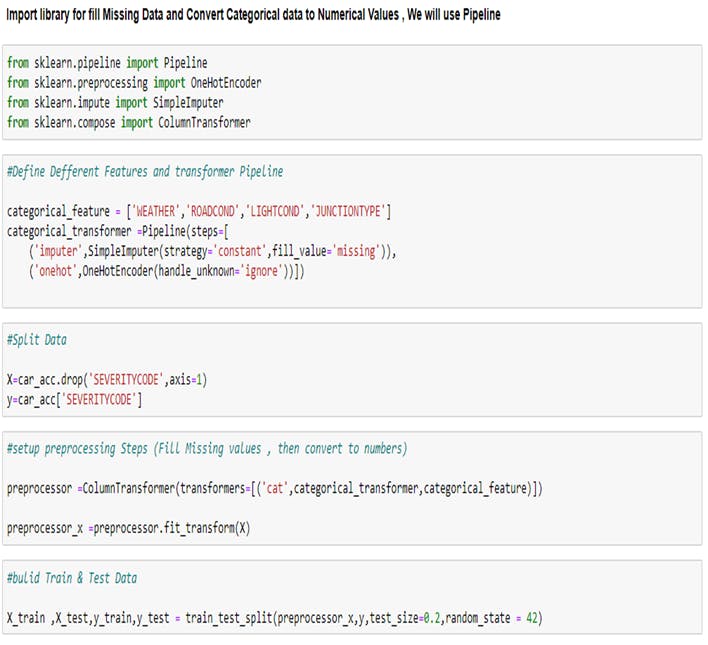
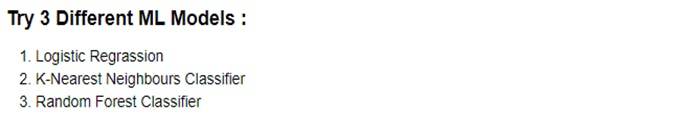
- Define Function to Fit and Score all models in one cell:
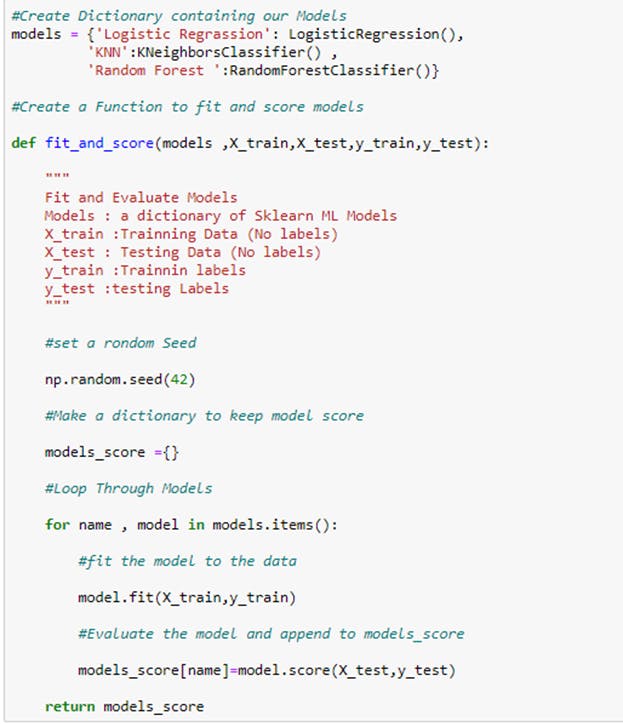
- It takes times to run
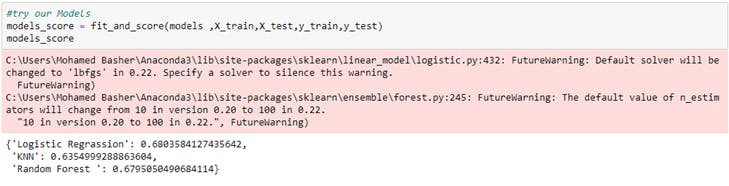
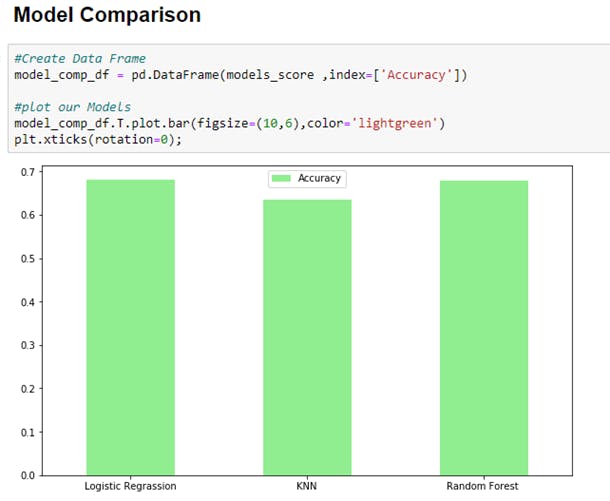
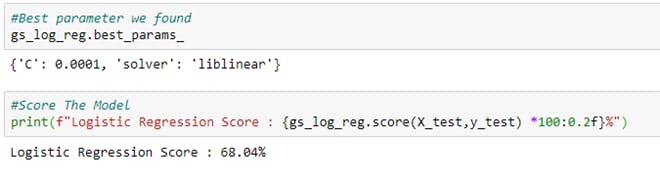
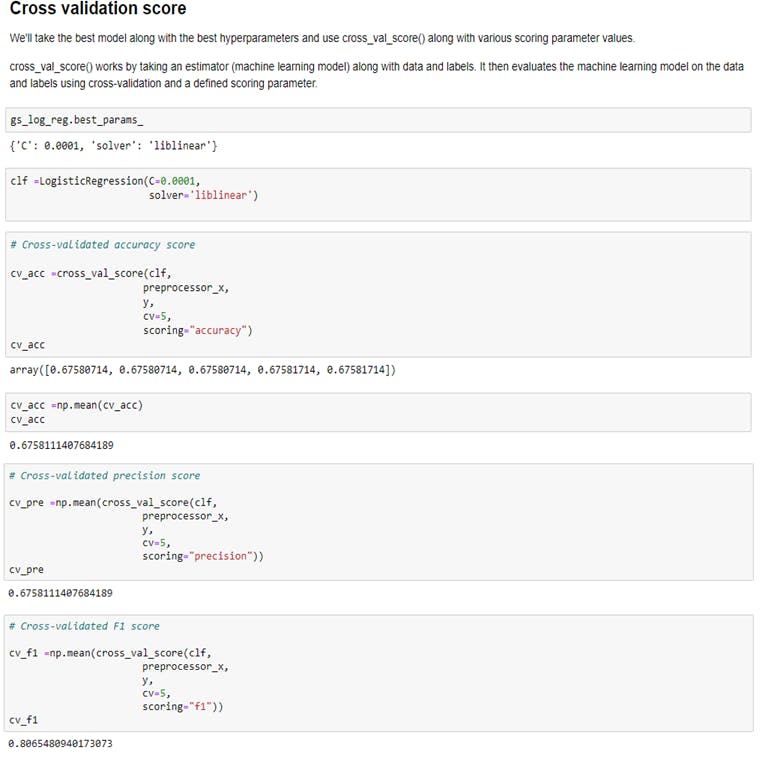
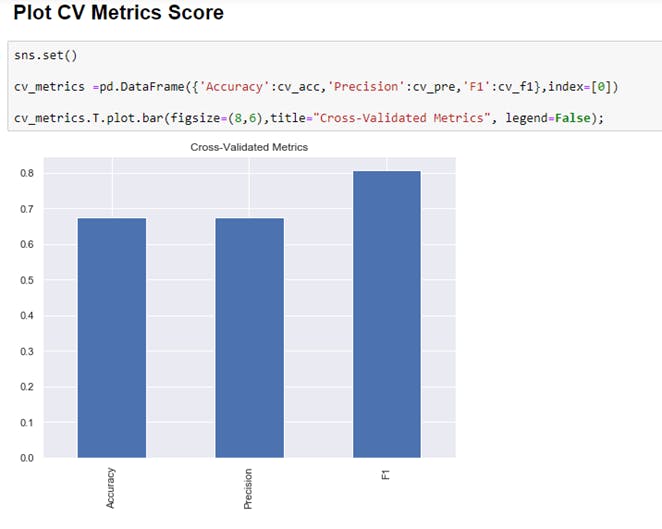
-Try to improve our model by using different Parameter
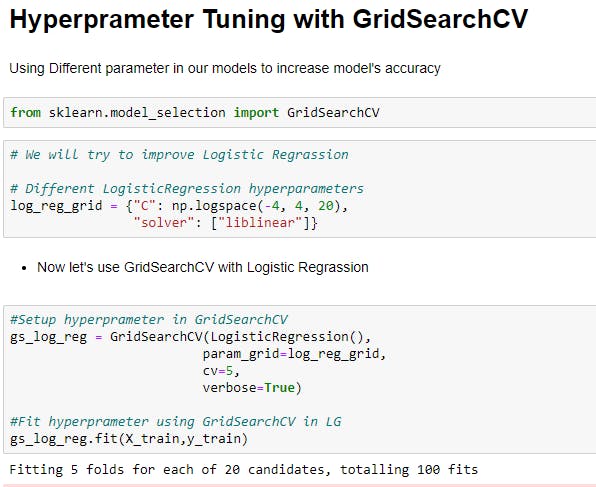
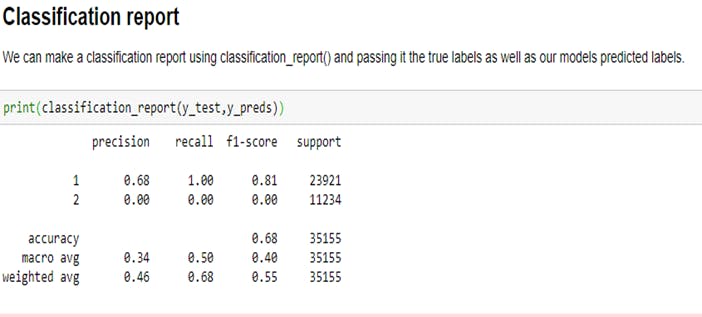
- I Face some problem with my PC when I try in Random Forest and KNN, so I will work in Logistic Regression
5.Discussion
After the analysis data, we found
most car accident severity :
              - prop damage
              - injury
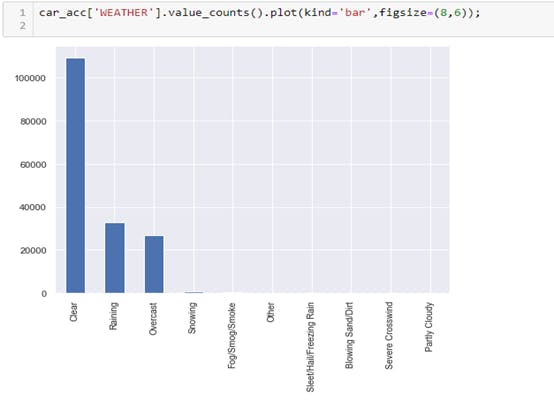
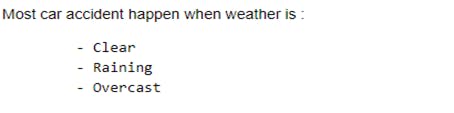
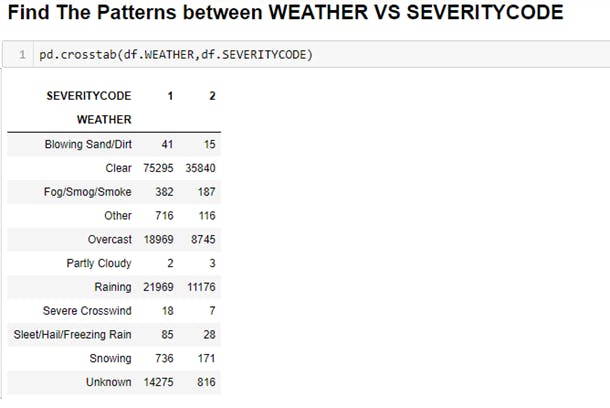
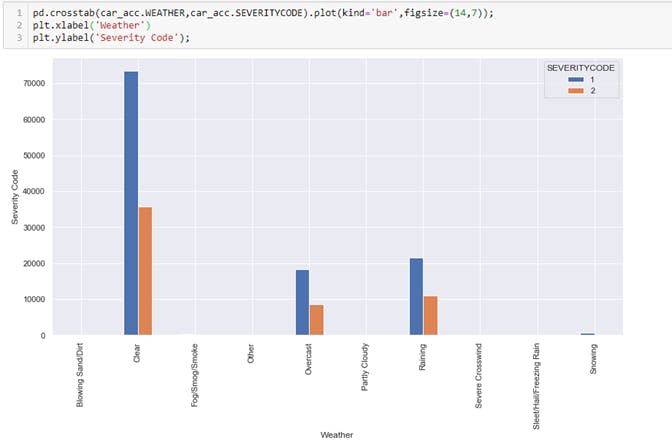
Most car accident happens when the weather is :
               - Clear
               - Raining
               - Overcast
The condition of the road during the collision is :
              - Dry
              - Wet
6.Conclusion
We need to add some other models to precisely predict traffic accident severity. We need to improve the accuracy of the model too
In the future, this model still needs improvement, and we need some additional features to increase prediction accuracy